Chart patterns are one of the simplest and most reliable ways to understand real market behavior. And when you focus on the 5 chart patterns that matter most, you start seeing exactly what buyers and sellers are doing without loading your screen with indicators. These core patterns help you identify reversals, continuations, and breakout opportunities with far more confidence
The explanation below breaks down the only five chart patterns every trader should truly master especially beginners and working professionals who trade part-time and need clarity, not confusion
1. Double Top – When the Market Says “Trend Over”
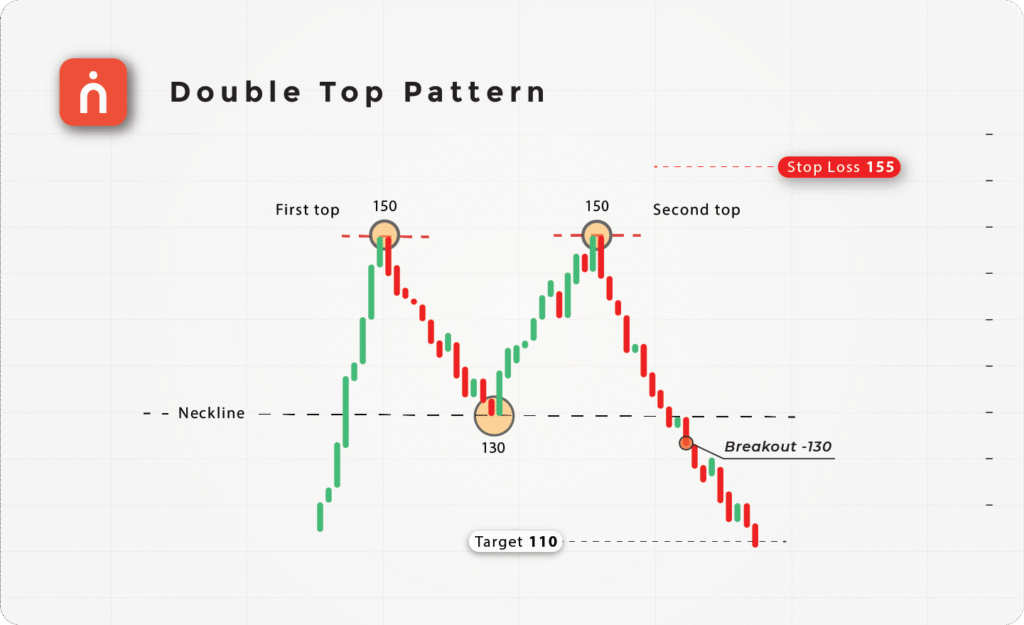
A double top forms when price hits the same resistance twice and fails. It is a clear signal that buyers have lost strength and the uptrend is weakening. The pattern is only confirmed when the neckline breaks never before
A simple rule:
Let the pattern complete, then act. Entering early is what causes most losses
2. Double Bottom – When Buyers Quietly Take Control
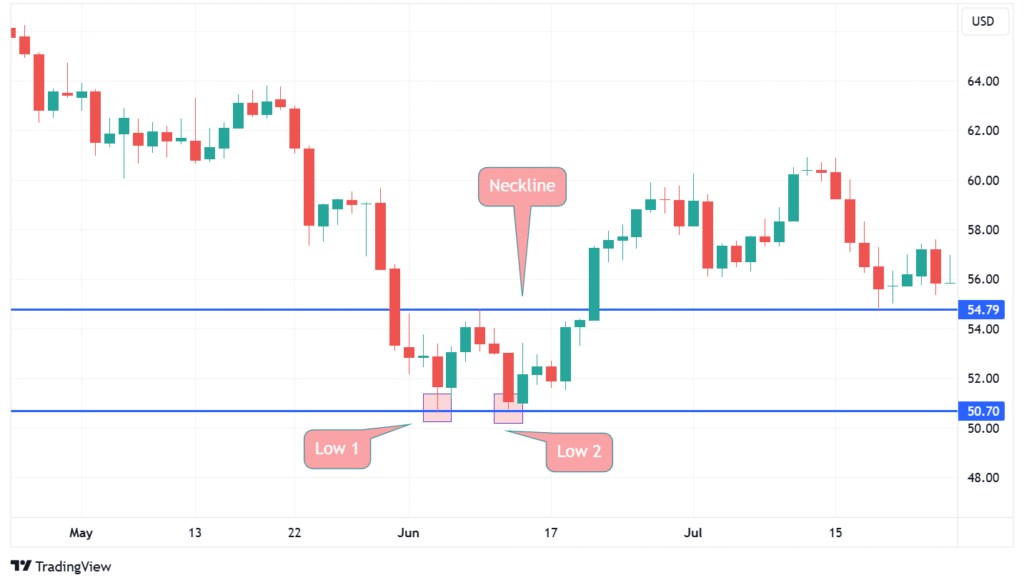
A double bottom forms when price tests support twice and refuses to go lower. This shows accumulation. Institutions often buy heavily here while retailers panic-sell. When the neckline breaks, a new uptrend often begins
It is one of the safest reversal structures for beginners
3.Triangle Patterns – A Big Move Is Coming
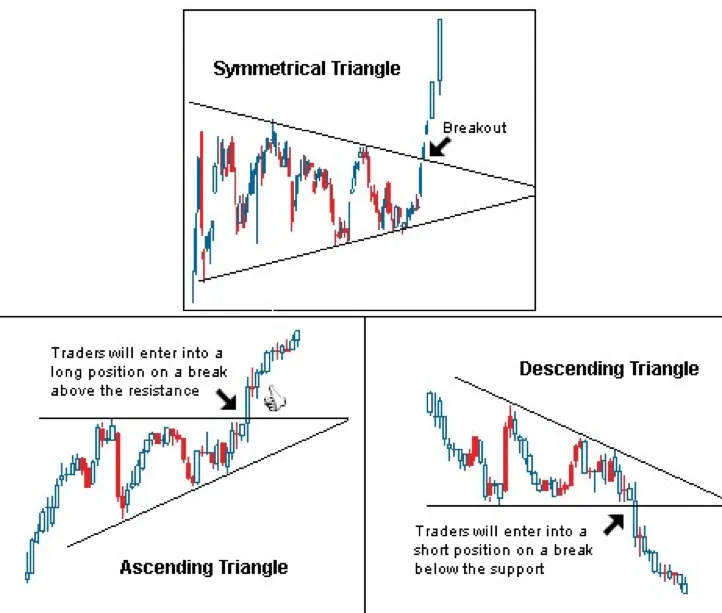
Triangles form when price compresses into a tighter structure. Volume drops, candles shrink, and the market “loads” for a larger breakout. The actual move begins only after a decisive breakout candle
Trading inside triangles is risky; waiting for the breakout is where the accuracy lies
4. Head and Shoulders – The Most Reliable Reversal Pattern
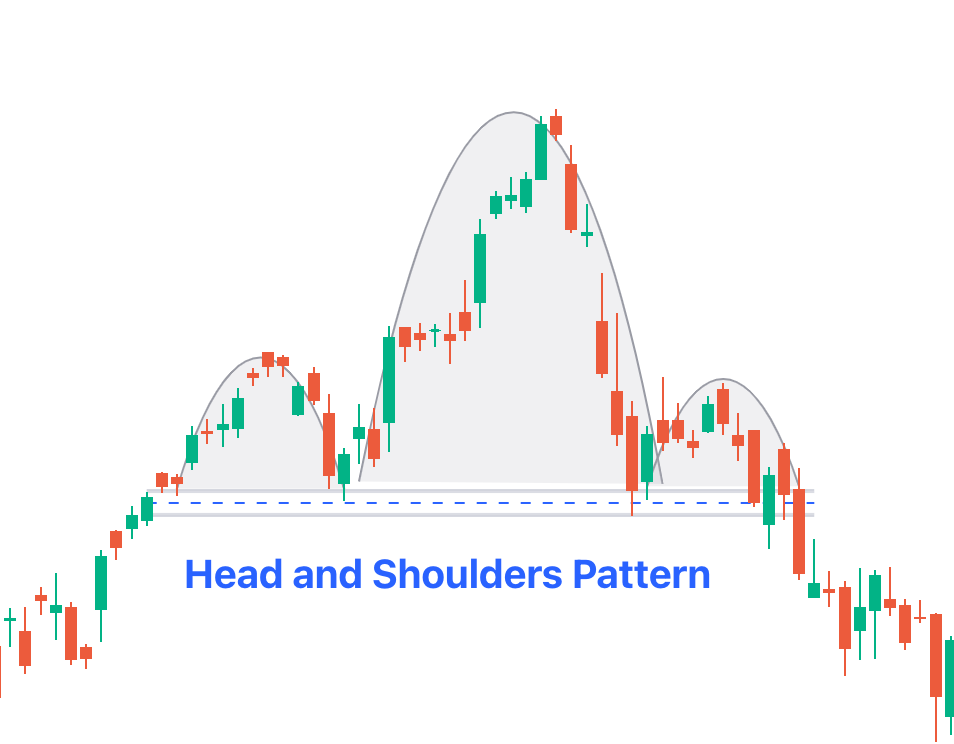
This pattern signals that an uptrend is weakening. The left shoulder shows a strong push, the head shows the last aggressive high, and the right shoulder shows clear weakness. After the neckline breaks, reversals are often strong
The inverse version works beautifully for bottom reversals
5. Flags and Pennants – The Strongest Continuation Patterns
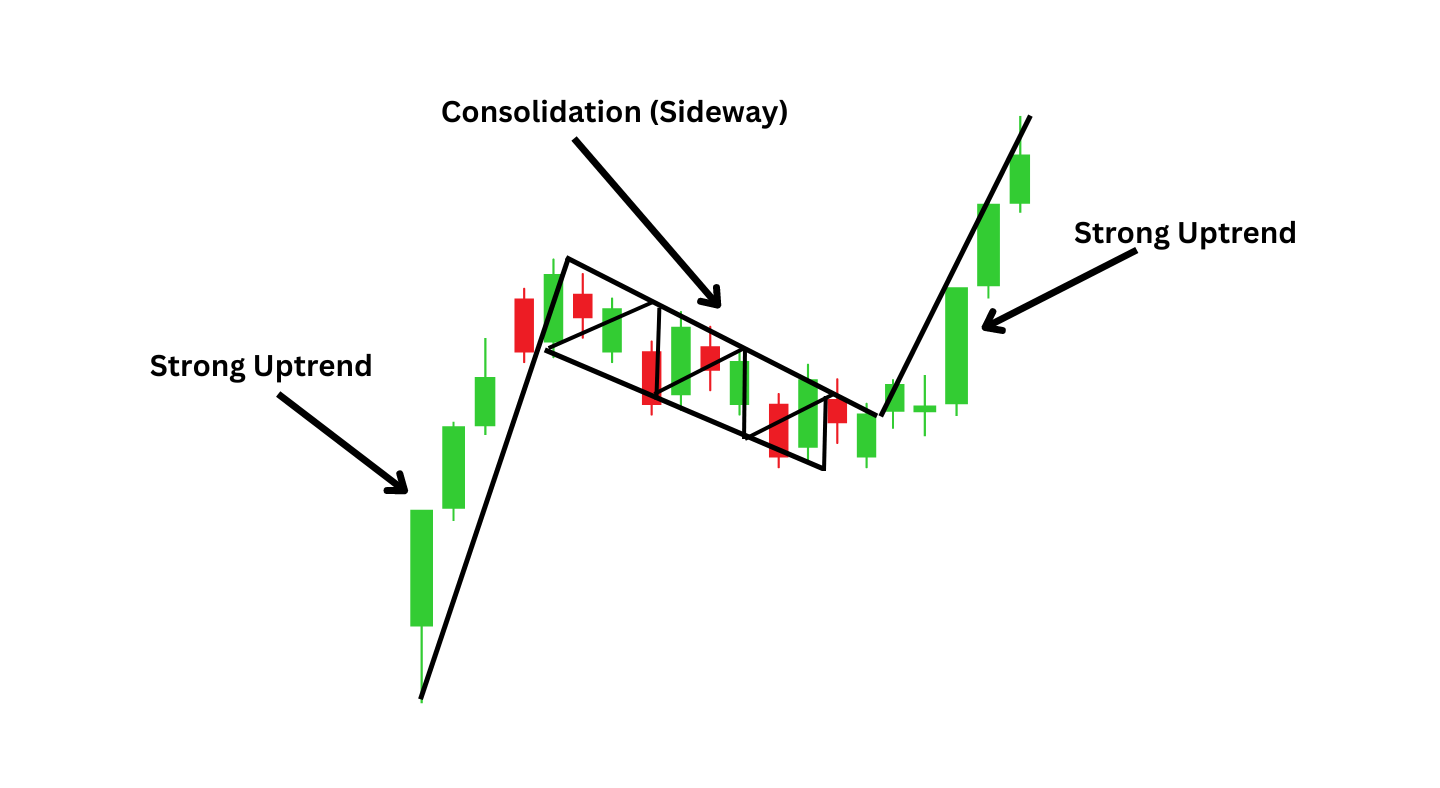
Flags appear after a sharp move, followed by a small, tight consolidation. This pause is healthy institutions accumulate more positions before pushing the trend again. A clean breakout often leads to powerful continuation
A good flag is tight, controlled, and forms in a narrow channel. Messy flags are unreliable
Why These 5 Patterns Are Enough
These patterns reflect actual market psychology, not theoretical shapes:
Double Top exhaustion
Double Bottom accumulation
Triangles compression
Head & Shoulders reversal
Flags continuation
Master these five, and you understand almost everything price wants to tell you
Smart Disha’s View
At Smart Disha, chart patterns are taught as part of a complete system. Patterns matter, but only when combined with risk management, psychology, and structured rule based execution
If you want guided, practical learning, training from a stock market training ahmedabad helps you avoid years of unnecessary trial and error
FAQ
Q1. Which chart pattern is the most reliable for beginners?
Head and Shoulders and Double Bottoms are the most stable patterns because they clearly show exhaustion and reversal. They are easy to identify even for beginners
Q2. Do chart patterns really work in the Indian stock market?
Yes. Human psychology drives all markets NSE, BSE, Forex, Crypto. Patterns work anywhere because crowd behaviour is universal
Q3. Are chart patterns enough to trade profitably?
No. Patterns are only tools. You also need trend analysis, volume confirmation, risk management, and proper stop-loss rules
Q4. Which timeframe is best for chart patterns?
Higher timeframes (30-min, 1-hour, daily) give cleaner and more reliable structures. Very small timeframes often create noise
Q5. Does Smart Disha teach chart patterns as part of a complete trading system?
Yes. Smart Disha Academy teaches chart patterns along with risk management, psychology, position sizing, stop-loss logic, market structure, and practical case studies