Alright, let’s talk about candlestick patterns. If you’re diving into stock trading in India, this stuff is non-negotiable. I know, it sounds a bit technical at first, but trust me—it’s easier than you think. Plus, once you get the hang of it, you’ll start seeing trends in the market like you’ve got X-ray vision. Cool, right? Let’s get into it.
What Are Candlestick Patterns in Stock Trading?
Here’s the thing: candlestick patterns are basically your crystal ball for stock price movements. Okay, maybe not a crystal ball, but they’re pretty darn close. They show you what’s happening with a stock’s price over a specific time period—like a day, an hour, or even a minute.
Each candlestick on a chart tells a little story: where the price started, where it ended, and the drama in between. If you’re serious about trading, learning to read these patterns is a game-changer.
Breaking Down a Candlestick

Before we dive into the patterns, let’s quickly dissect a candlestick:
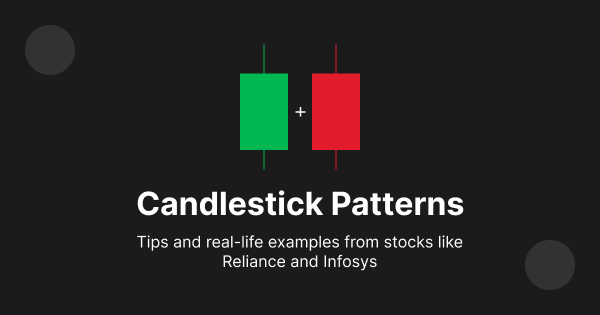
- Body: This is the fat rectangle in the middle. It shows the range between the opening and closing prices. If the stock closed higher than it opened, the body’s green (or white). If it closed lower, it’s red (or black).
- Wick/Shadow: Those lines sticking out above and below the body? That’s the wick (or shadow). They show the highest and lowest prices during that time.
- Top of the Wick: The highest price the stock hit.
- Bottom of the Wick: The lowest price.
See? Not so bad.
Why Candlestick Patterns Matter
Imagine this: you’re watching a cricket match. The scoreboard doesn’t just tell you the score; it shows you how the game’s unfolding. Candlestick patterns? Same deal, but for the stock market. They help you figure out if a stock’s about to go up, down, or stay put.
Here’s where it gets interesting—they’re especially good at predicting reversals (when a stock’s price changes direction) and confirming trends. Ready to see some examples? Let’s go.
Common Bullish Candlestick Patterns
These patterns scream, “Hey, the stock’s about to go up!” Perfect for when you’re looking to buy.
1. Bullish Engulfing Pattern
Picture this: a tiny red candle (representing a down day) gets completely swallowed by a big green candle (a strong up day). That’s your bullish engulfing pattern—a clear signal that the stock might be gearing up for a rally.
Example: Imagine Reliance stock has been in a slump. Suddenly, you spot this pattern. Boom, it’s a sign things are turning around. Time to consider buying? Maybe.
2. Morning Star
This one’s a three-candle combo: a big red candle, a small indecisive one (like a doji), and then a big green candle. It’s basically the market saying, “Okay, we’ve hit bottom. Let’s bounce back.”
Example: Tata Motors had a rough week, but then—bam—a morning star pattern pops up. That’s your cue that buyers are coming back.
3. Hammer
The hammer looks like, well, a hammer. Small body, long lower wick. It’s the market’s way of saying, “Sellers tried to push the price down, but buyers weren’t having it.”
Example: You’re checking Infosys and spot a hammer after a steady decline. That’s your hint: a reversal might be on the way.
Common Bearish Candlestick Patterns
Bearish patterns are the party poopers of the stock market. They tell you when a stock’s price might drop.
1. Bearish Engulfing Pattern
Flip the bullish engulfing pattern on its head. Now, it’s a small green candle followed by a big red one. Translation? Sellers are taking over.
Example: Let’s say HDFC Bank has been climbing, but then this pattern shows up. It might be time to lock in profits.
2. Evening Star
The evening star is the evil twin of the morning star. Big green candle, small indecisive one, and then a big red candle. It’s a classic reversal signal.
Example: You’re eyeing TCS stock, and this pattern forms after a solid rally. Heads-up: a drop could be coming.
3. Shooting Star
This one’s easy to spot: a small body with a long upper wick. It’s like the market reached for the stars but couldn’t hold on.
Example: The Nifty 50 index shows a shooting star after a big run-up. Chances are, a pullback’s around the corner.
How to Use Candlestick Patterns in the Indian Stock Market
Okay, now that you know the patterns, how do you actually use them? Here’s a simple strategy:
- Check the Trend: First, figure out if the stock’s in an uptrend, downtrend, or just chilling sideways.
- Look for Patterns: Spot patterns that confirm the trend or hint at a reversal.
- Combine with Other Indicators: Don’t rely on candlesticks alone. Pair them with tools like Moving Averages or RSI for better accuracy.
- Use Reliable Platforms: Platforms like Sharekhan or TradingView are great for studying candlestick charts. Just switch to the candlestick view and start analyzing.
Real-Life Examples from Indian Stocks
Let’s make this real with some examples:
- Reliance Industries: In early 2023, after a strong rally, a bearish engulfing pattern showed up. Sure enough, the stock pulled back shortly after.
- Infosys: Late 2022, a morning star pattern appeared after a decline. What happened next? A steady climb over the next few weeks.
Best Trading Platforms for Candlestick Charts in India
If you’re serious about trading, you need good tools. Here are some top picks:
- Sharekhan: Excellent charting tools and user-friendly interface.
- TradingView: Perfect for beginners and pros alike. Plus, it’s got tons of tutorials.
Conclusion
Candlestick patterns are like the cheat codes of stock trading. They won’t guarantee success, but they’ll definitely give you an edge. Next time you’re analyzing a stock—whether it’s Reliance, Infosys, or something else—keep an eye out for these patterns. And hey, don’t just take my word for it. Try spotting a few yourself and see how they play out. Good luck, and happy trading!


