Flag pattern breakout NSE is one of the most powerful signals traders look for when trying to catch strong momentum in the stock market. Many traders struggle because they enter trades too early or too late. They see price moving but don’t understand whether the move has strength behind it
This is where the flag pattern becomes important
A flag pattern is not just a chart shape. It reflects real market psychology a pause after a strong move before the next potential breakout. Traders who understand this pattern often find themselves entering trades with more confidence and clarity
What Is a Flag Pattern in the Stock Market
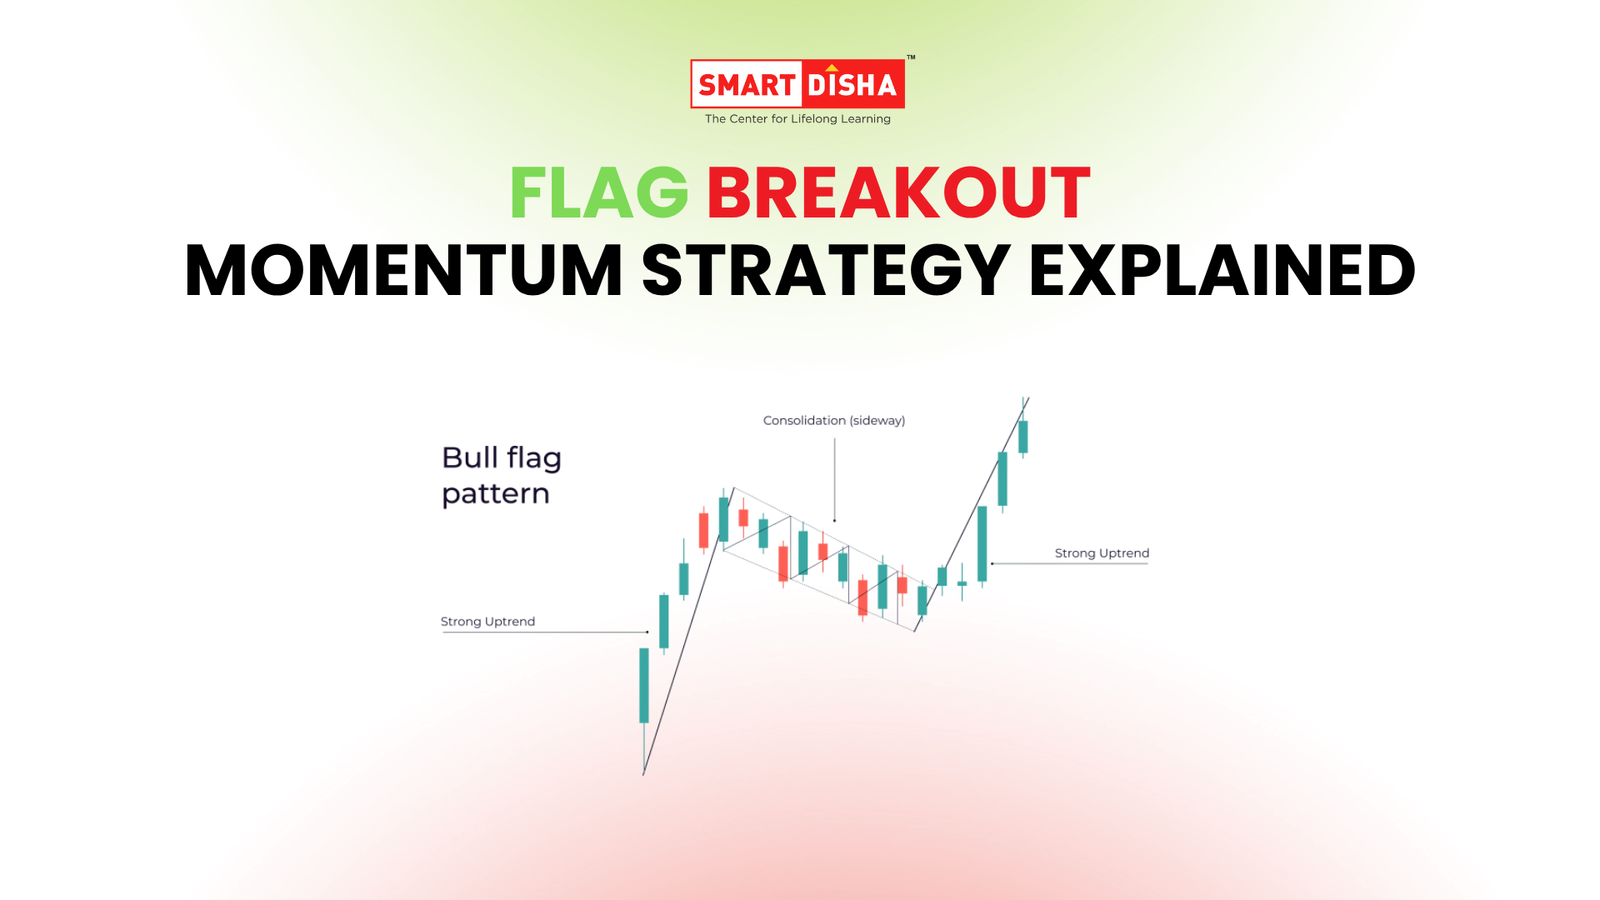
A flag pattern forms when a stock makes a strong upward or downward move, followed by a short period of consolidation
This consolidation looks like a small channel or sideways movement, forming what traders call a “flag”
After this pause, if the price breaks out in the direction of the original trend with strong volume, it is called a flag pattern breakout
In simple words:
- Strong move
- Short pause
- Breakout continuation
This pattern shows that the market is taking a breather before continuing the trend
Why Traders Watch Flag Pattern Breakout NSE
Traders closely monitor flag pattern breakout NSE stocks because these setups often lead to strong price movements
When a stock forms a flag pattern, it usually means:
- Buyers are still active
- Selling pressure is limited
- Market is preparing for the next move
When the breakout happens with high volume, it indicates that momentum is returning
For traders, this creates an opportunity to enter trades with better probability
How to Identify a Flag Pattern Breakout
To identify a flag pattern breakout NSE, traders follow a simple process
Strong Initial Move
The stock should show a sharp upward or downward move. This is called the flagpole
Consolidation Phase
After the move, the price should consolidate in a small range. This forms the flag
Breakout with Volume
The most important step is the breakout. Price should break above the flag with strong volume
Without volume confirmation, the breakout may fail
Example Structure of Flag Pattern
| Stage | Description |
| Flagpole | Strong price movement upward or downward |
| Consolidation | Small sideways or downward channel |
| Breakout | Price moves above resistance with volume |
This structure helps traders visually identify the pattern on charts.
When Flag Pattern Breakouts Work Best
The flag pattern breakout NSE works best in trending markets
Bullish Market Conditions
In an uptrend, bullish flag patterns often lead to continuation of upward movement
Strong Sector Momentum
If a particular sector is performing well, stocks in that sector may show stronger breakout patterns
High Volume Participation
Breakouts supported by volume are more reliable
Emotional Reality of Trading Breakouts
Many traders miss good opportunities not because they lack knowledge, but because of fear and hesitation
They see the breakout, but they doubt themselves
Some enter too early and get trapped. Others wait too long and miss the move
The truth is, no strategy is perfect. But patterns like flag breakout give traders a structured way to think instead of guessing
At Smart Disha, the focus is not just on strategies, but on building the mindset to trade with discipline and confidence
Risks of Flag Pattern Breakout
While the strategy can be powerful, traders must be aware of risks
False Breakouts
Sometimes price breaks out but quickly reverses. This is common in low volume situations
Market Conditions
If the overall market is weak, even strong patterns can fail
Lack of Risk Management
Without proper stop-loss, even a small mistake can lead to losses
Because of this, traders should always combine pattern analysis with risk control
Why Learning Chart Patterns Is Important
Many beginners rely on tips or social media recommendations. But successful traders depend on price action, patterns, and volume analysis
Understanding patterns like flag breakout helps traders:
- Identify opportunities early
- Avoid emotional decisions
- Improve consistency
Market knowledge is what separates random trading from structured trading
FAQ
What is flag pattern breakout in NSE?
Flag pattern breakout in NSE is a continuation pattern where price breaks out after a short consolidation following a strong move
Is flag pattern reliable in trading?
It can be reliable when combined with volume confirmation and overall market trend
How to confirm flag breakout?
Traders confirm breakout using price movement above resistance along with high trading volume.
Can beginners use flag pattern strategy?
Yes, but beginners should first learn chart analysis and risk management before trading
Which timeframe is best for flag pattern?
Flag patterns can work on multiple timeframes, but many traders prefer 15-minute, hourly, or daily charts
Final Thoughts
The flag pattern breakout NSE is a powerful tool for traders who want to capture momentum in the market. It is simple to understand but requires discipline to execute correctly
Instead of chasing random trades, traders who follow structured patterns like flag breakouts often develop better confidence and consistency
If you want to understand how to read charts, identify breakout patterns, and improve your trading skills, you can explore the stock market courses in Ahmedabad offered by Smart Disha Academy