Stock trading can feel like navigating a maze—full of twists, turns, and market volatility. But what if there was a way to simplify this complexity? Enter moving averages: a straightforward yet powerful tool to identify trends, gauge momentum, and refine your buy or sell decisions
Whether you’re a beginner or someone with some experience in stock trading, this guide will help you understand how moving averages can level up your trading game, especially in the Indian market
Let’s dive in
What Are Moving Averages?
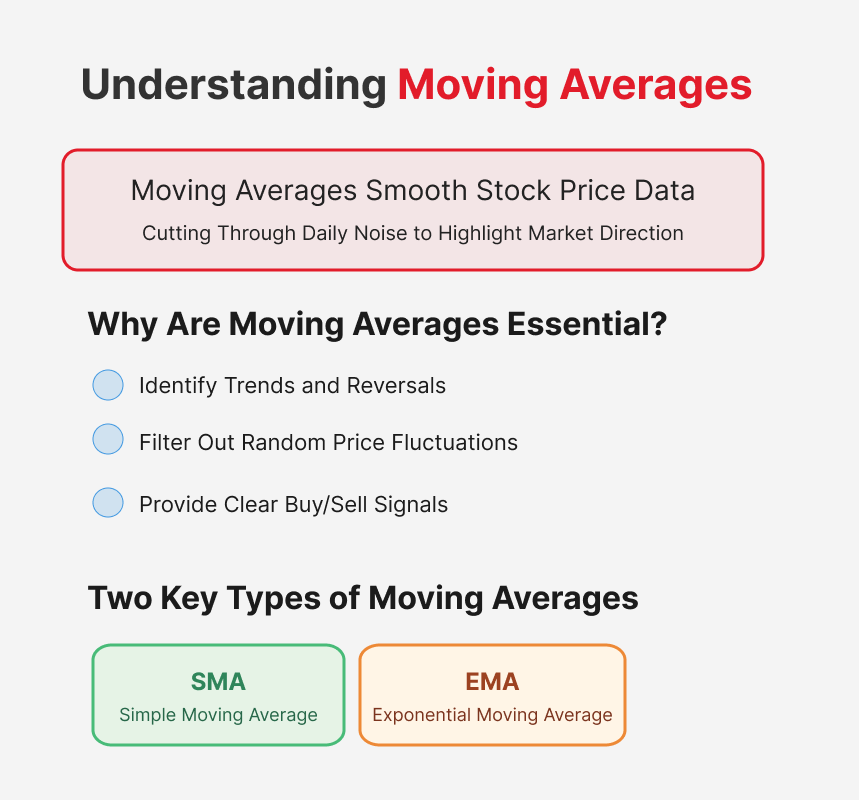
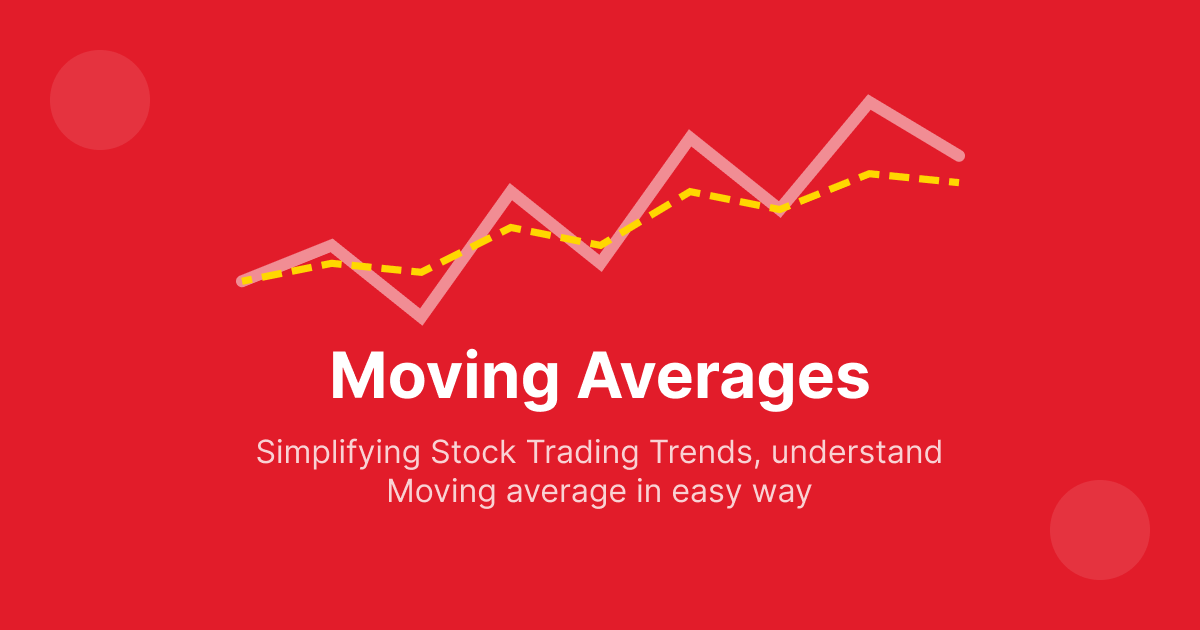
At their core, moving averages smooth out stock price data over time, cutting through daily noise to highlight the market’s direction

Why are they essential?
- They help identify trends and reversals
- They filter out random price fluctuations
- They provide clear buy/sell signals when used with other indicators
There are two key types of moving averages: Simple Moving Average (SMA) and Exponential Moving Average (EMA). Let’s explore them one by one
1. Simple Moving Average (SMA): The Foundation of Trend Analysis
What is SMA?
The SMA calculates the average stock price over a specific time period. For example, a 10-day SMA adds the prices of the past 10 days and divides by 10
How does it work?
- Above SMA: If the stock price moves above its SMA, it’s often a bullish signal (buy)
- Below SMA: If the price drops below, it might signal bearish momentum (sell)
Example: Tata Motors
Imagine analysing Tata Motors with a 50-day SMA. If the price crosses above the SMA, it suggests an upward trend. If it drops below, it indicates bearish momentum
Pro Tip: SMA works best for analysing long-term trends as it reacts slowly to sudden price changes
2. Exponential Moving Average (EMA): The Faster Alternative
What is EMA?
Unlike SMA, EMA assigns more weight to recent prices, making it more responsive to quick market changes
How does it work?
- Quick Entry/Exit: EMA reacts faster, making it ideal for active traders
- Bullish/Bearish Signals: When prices cross above or below the EMA, it signals potential buying or selling opportunities
Example: HDFC Bank
A 20-day EMA on HDFC Bank stock reacts swiftly to price changes. If the price crosses above the EMA, it’s a buying signal. If it dips below, it may be time to sell
Pro Tip: EMA is perfect for short- to medium-term trading in volatile markets
Difference between SMA & EMA
| Feature | Simple Moving Average (SMA) | Exponential Moving Average (EMA) |
|---|---|---|
| Calculation Complexity | Simple arithmetic average | Weighted calculation with multiplier |
| Responsiveness to Price Changes | Slower to react | Faster to react to recent prices |
| Weighting of Data Points | Equal weight to all data points | More weight to recent prices |
| Lag Characteristic | Higher lag, slower trend indication | Lower lag, quicker trend signals |
| Best Used For | Long-term trend analysis, stable markets | Short-term trading, volatile markets |
How to Use Moving Averages for Buy/Sell Signals
Crossover Strategy: A Simple Approach
This involves two moving averages:
- A longer SMA (e.g., 50-day)
- A shorter EMA (e.g., 20-day)
Signals:
- Golden Cross: Shorter EMA crosses above the longer SMA → Buy
- Death Cross: Shorter EMA crosses below the longer SMA → Sell
Example: Nifty 50
Suppose you’re analyzing the Nifty 50 index using a 50-day SMA and a 20-day EMA. If the EMA crosses above the SMA, it signals market momentum is increasing (buy). If it crosses below, it may indicate a downturn (sell)
Combine Moving Averages with Other Tools
Moving averages alone can be effective, but they’re even more powerful when paired with other indicators like:
- Relative Strength Index (RSI): Helps confirm if a stock is overbought or oversold
- Moving Average Convergence Divergence (MACD): Adds another layer of precision by showing momentum
Example:
If a 50-day SMA suggests an upward trend but the RSI shows the stock is overbought, you might delay buying to avoid losses
Pro Tip: This combination reduces the chances of false signals and improves accuracy
FAQ: Your Common Questions Answered
- What’s the difference between SMA and EMA?
SMA treats all prices equally, while EMA focuses more on recent prices - How do moving averages help in trading?
They smooth out price fluctuations, making trends and signals easier to spot - Which moving average is best for Indian traders?
SMA is ideal for long-term trends, while EMA suits short-term, active trading
Conclusion
Moving averages like SMA and EMA are indispensable tools for any trader. They simplify market analysis, provide actionable signals, and help you make smarter decisions
Ready to try?
Apply SMA and EMA to your favorite Indian stocks today using platforms like TradingView or Sharekhan. With practice, you’ll soon unlock their full potential


